Sizing the European Printing Industry
For many years WhatTheyThink has been running regular articles on sizing the US printing industry, with a comprehensive overview of the total market, looking at several sub-segments, and the drivers behind demographic changes in those segments.

For many years WhatTheyThink has been running regular articles on sizing the US printing industry, with a comprehensive overview of the total market, looking at several sub-segments, and the drivers behind demographic changes in those segments. Probably many wondered if there is information available on other regions. Time to give it a start: we’ll begin with Europe.
Getting good data on the European printing industry is hampered by several facts—and not just because of the upheavals wrought by COVID-19. First, there is no unambiguous definition of “Europe.” To make the sizing a bit easier, I exclude Russia and the CIS states, as well as the European part of Turkey. Another challenge is that every country has a national statistical office—in its local language. Fortunately, at least all countries in the European Union report to Eurostat (the statistical body of the European Union), but a closer look at the data reveals that standards differ, as do the timeliness and completeness of data. Furthermore, the European statistical classification system has far less detail than the US system. Besides prepress and postpress companies, there are only two types of printing companies accounted for: “newspaper printers” and “all other printers!” Some kinds of print establishments like label and packaging printers and copy shops are found in other business segments outside of printing. Establishments like in-house print or data center printing are not accounted for at all. It should not be a surprise that industry numbers published differ considerably.
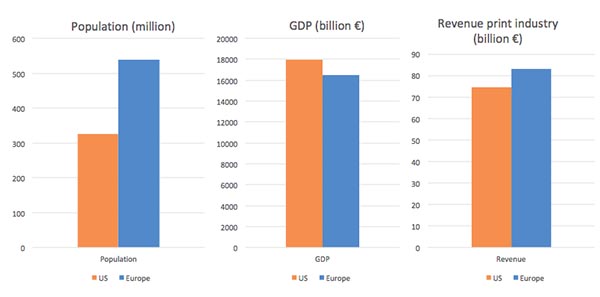
To put the printing industry sizing into perspective, it is good to have a look at some base stats as well. When comparing Europe and the US, Europe has a noticeably higher population, by about 40%. The GDP for Europe falls behind, however. While some countries (Switzerland, Norway, Luxemburg) have a very high per capita GDP, it is much lower in many other countries.
Unlike GDP, the printing industry revenue in Europe is higher compared to the US, by about 10% and revenues stood at about €83 billion in 2017, the most recent year for which EU-wide information is available (European statistical offices don’t work that quickly). This is based on comparing the core print industry segments including pre- and postpress companies, but without packaging, copy shops, and the like. Obviously the COVID-19 impact has not been figured in, but for a comparison between US and Europe, and for countries within Europe ,the ratios should be just fine.
Comparison of US and Europe
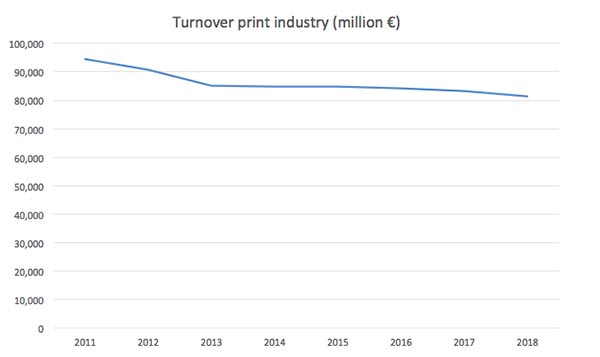
After a decline in 2011/2012, the turnover (that is, revenues) in the printing industry remained relatively stable until 2018. There have been some shifts within the countries, but the total European revenue remained very close to the €84 billion mark. Revenues slowed in 2017, however, being 1.3% lower than the year before. 2018 data is still provisional, but with €81.4 billion, they are about 2% lower again. For 2019, I would expect a similar slowdown—which will make numbers look pretty stable after 2020 data is in.
Print Industry Revenues, Europe 2011–2018
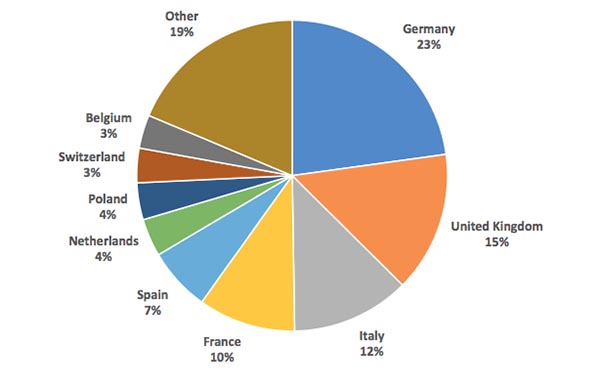
As one would expect, the print industry size per country differs a lot and no surprise either is that the larger economies contribute the most to the total print industry revenue in Europe. Germany leads with a 23% share, followed by the UK. It is a bit surprising to see France trailing Italy, given the size of the French economy, but France is a net importer of printed products, while the other large countries are net exporters. Poland is the largest Eastern European state in terms of print revenue and the share is on the rise due to increasing exports into Western Europe. More than 25 countries make up the remaining 19%, the exact numbers depending a bit on how the city-size states are being counted.
European Print Industry Revenue by Country
Comparing revenues is still relatively easy, but national statistical data in Europe diverges in how they account for establishments. Some countries report very high establishment numbers given the revenue and employment numbers in print. This is likely due to companies registered for tax and corporate reasons only, without employees and without real business activity. This can also lead to large annual fluctuations in Eurostat numbers for some countries, which are beyond any natural changes in company numbers.
In the US, in 2017 about 23,800 firms were counted, with about 25,200 establishments. Eurostat reports about 113,000 enterprises active in print for the same year (again excluding label, packaging, copy shop, and in-plants). Although given that Europe has a lot more small companies, especially in the smaller countries, this number is overstated. There are some methods to adjust for companies without business activity and after working on European print statistics for many years, I believe a more realistic number would be around 68,000. About 80% of them have less than 10 employees. Less than 200 companies could be considered large printing companies and have 250 employees or more.
The next article will focus on the print production decline caused by the COVID-19 pandemic based on the latest monthly production index data, including an overview of impact it has in the major countries. In the following months, I will have a closer look at some countries by looking at revenue developments, sites, and employment.
